

Almost universally, corporate legal departments want to know more about how to leverage data (like almost every other business unit), what they can do with it, what others are doing with it, and how to use it to create standardized reports.
In the first post in this series, we dove into how Fortune 500 legal departments are doing more with less using legal technology to streamline processes, as revealed by Brian McGovern’s interviews with over 130 legal departments in 20+ industries. When it comes to leveraging data, their experiences provide a new set of lessons.
What they often discover, according to Brian’s interviews? How their standardized reports become more and more customized over time, and how many of the reports they create never get used.
The problem? They’ve started off by thinking about the reports they want to generate, rather than first developing a strategy.
Making data work on behalf of a legal department isn’t simply about gathering more data and churning out reports. It’s about getting the right data to the right people at the right time.

Start with strategy, end with reports
Strategy will dictate the activities and processes to fulfill it, and the KPIs needed to measure results. Only then can you produce relevant reports.

Once you’ve put a strategy in place, you can move on to identifying and measuring the activities supporting it. It’s important to rememeber that great metrics only come from a great understanding of vital activities. The following three steps will allow you to leverage relevant, useful metrics from the activities you want to track and optimize so they’re creating real value.

First, focus on specific activities. Ask people how they’re making decisions around that process; don’t be surprised to hear the words, “it’s just the way we’ve always done it.”
The best activities to begin with? High-volume processes where you can make the greatest, most immediate impact. Identify the data sources currently being used to measure them; if you’re just starting out, sources may not be available for these processes, so tribal knowledge or your best judgment may have to substitute for the time being.

Next, determine the need: Instead of how it’s currently being done, what’s the best way to execute an activity? How should decisions be made to achieve that? Define what key metrics should be introduced into the process to help make this possible at those points when decision-makers can really use them.
Focus on driver metrics, not results metrics. The difference? Results metrics, as Brian puts it, are akin to “driving a car with a blacked-out windshield.” The only insights you have are about where you’ve already been. What did we spend last year? How did we perform on outcomes the past quarter?
Driver metrics let you “peel the paint off the windshield,” enabling you to recognize potential problems – or opportunities – before they arise. So you can be proactive in risk management, spend management, vendor selection and more. As Brian points out, companies that sink their resources into results metrics spend undue time looking backward in analyzing what’s already gone wrong, rather than focusing on what they can do to avoid problems in the first place.

Then, you should ensure timely and accurate delivery of the right data and insights to the decision-makers who are in a position to use it. As a legal department finds itself gathering more real-time data from more sources, aligning the right data sources with the right people becomes more important – and potentially difficult.
So it’s crucial to develop a process that incorporates the right tools to maintain accuracy and claity in your measurement and reporting. Visualization of data using color and graphics will assure clarity and ease of interpretation, too.
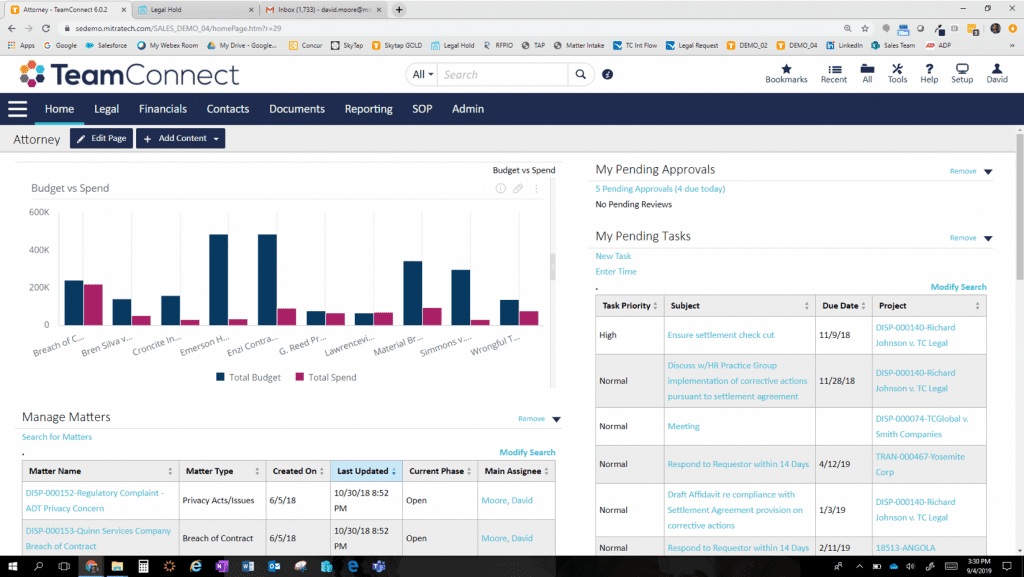
An example: For this activity, a Senior Leader Operational Review, the ELM platform in use in the dashboard image below plainly identifies the trouble spot revealed by the data. By visualizing near-real-time data that’s accurate and pertinent to a senior leader’s role, we equip him or her to quickly make informed decisions.
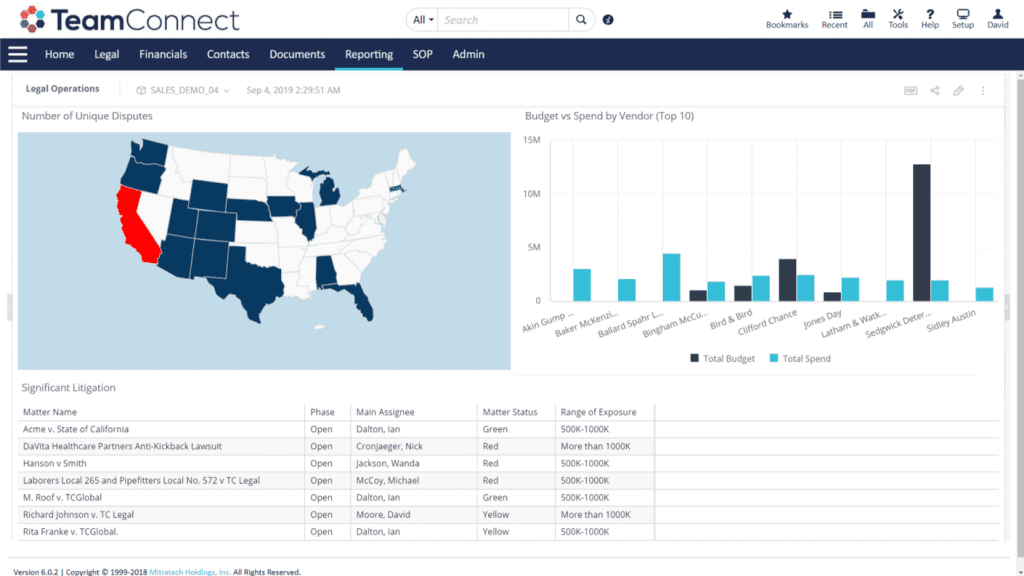 All figures are for demo purposes and do not represent actual numbers or budgets.
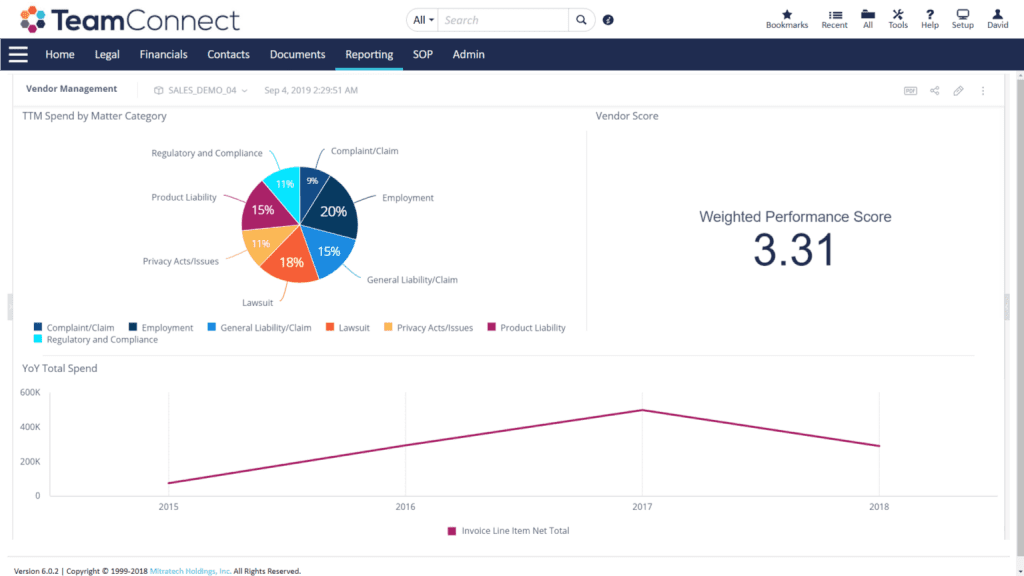
Another example? In outside counsel selection, leaders need insights into whether or not they should make continued use of an outside law firm, and how the firm has been used – and how it’s performed – in the past.
The Weighted Performance Score lets our decision-maker make immediate comparisons between this vendor and others. How can you gather that data? A simple survey when a matter is closed is a good way to start, though more advanced techniques like Natural Language Processing (NLP) can extract insights by rapidly parsing thousands of documents.
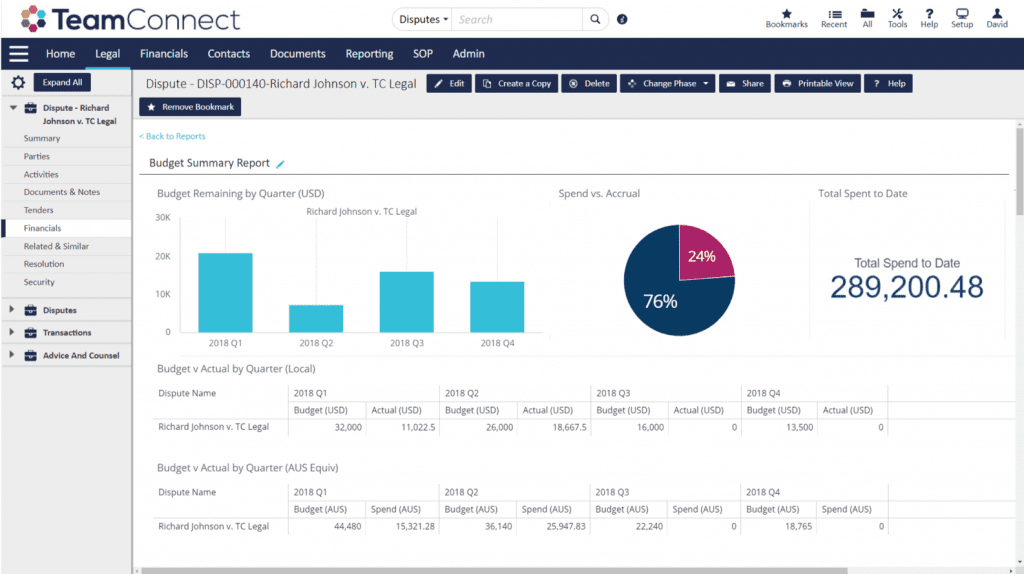
Another activity where centralizing and visualizing all the data a decision-maker needs? Budget management, as in this example of a specific matter budget.
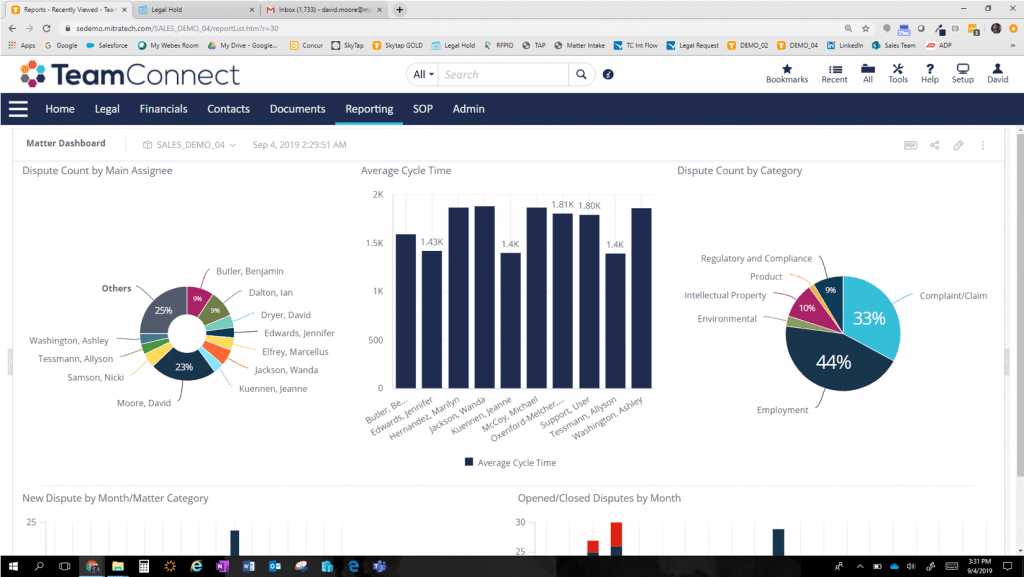
Work allocation is another activity where properly presented key data can assist a legal leader. Here, he or she can review individual workloads, how much time a matter cycle takes for each attorney, even where automation or other process tools can improve performance.
Finally, this example shows how data can help an attorney in prioritizing the workday.
One key point about these five examples: In each of them, the data being presented is aligned to different people with different responsibilities within the legal department. So the data, reports, and overviews they get must be specific to each of them. A general counsel, a Legal Ops manager, and a staff attorney have vastly different data needs.
It’s more than just metrics
Different legal departments are going to (obviously) be at different maturity levels when it comes to leveraging data. One that’s at the “table stakes” level will have few dimensions to its KPIs and limitations on the UX it employs, for instance, whereas an “innovative” legal department will be using leading-edge tools like NLP and interactive dashboards proactively sending alerts to users as problems are detected, with data being refreshed in close to real-time.
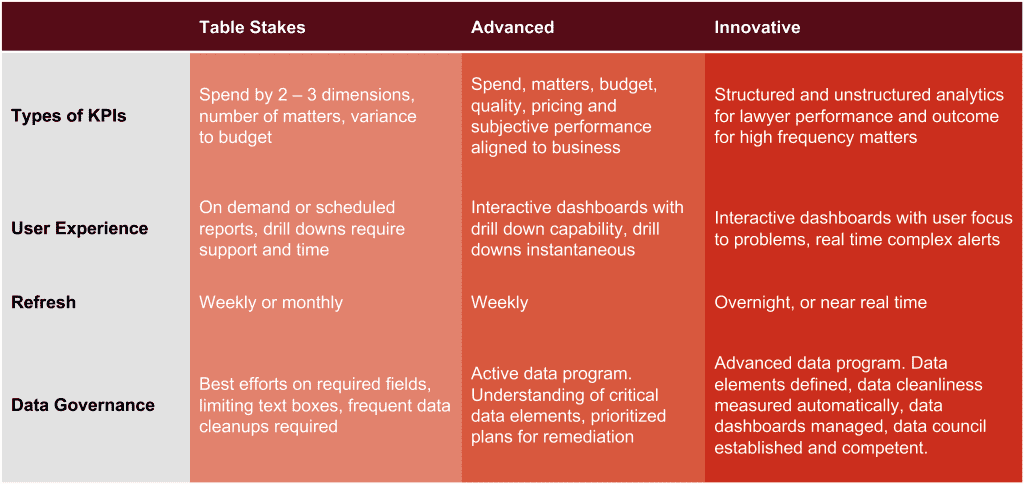
By applying a more advanced solution like NLP to analyze unstructured data, these departments open up a wealth of insights. Because, as Brian McGovern points out, “95% of the data held by a legal department is unstructured.”
Data governance will become more vital than ever as you evolve. The root data being used to populate basic Excel spreadsheets or high-end visualization tools should be subjected to increasingly sophisticated and rigorous levels of data hygiene, so it’s clean and accurate wherever it’s used.
Active data programs are in place at the “advanced” level, and data stewards and data councils are being used by “innovative” legal departments, as well as data dashboards reporting the results of automated audits of your data cleanliness.
The third insight?
Legal departments who are embarking on Legal Ops optimization can draw on the third major lesson to be gleaned from the Fortune 500 teams interviewed by Brian McGovern. It’s that technology can drive efficiency, and the right use of data can improve processes, but the human factor of Legal Operations is the third pillar of success.
In the next post in this series, we’ll examine how choosing the right people to staff Legal Ops is crucial – but who should you choose? That might not be as obvious as we’d like to assume.
Brian and Brian are chatting at #accam19 on @mitratechlegal’s latest research from the Fortune500. https://t.co/MJxBJbaD0m
— Above the Law (@atlblog) October 29, 2019